STOCKHOLM--(BUSINESS WIRE)--Jun 13, 2023--
Grafana Labs, the company behind the world’s most ubiquitous open and composable operational dashboards, today is announcing the release of Grafana 10 and kicking off celebrations for the open source project’s 10-year anniversary. The celebrations will include the annual GrafanaCON community conference and GrafanaCON Local meetups in more than 20 cities around the world this week, and the release of a documentary, chronicling the journey of the Grafana community, later this year. A teaser is being released today at GrafanaCON.
This press release features multimedia. View the full release here: https://www.businesswire.com/news/home/20230613705935/en/
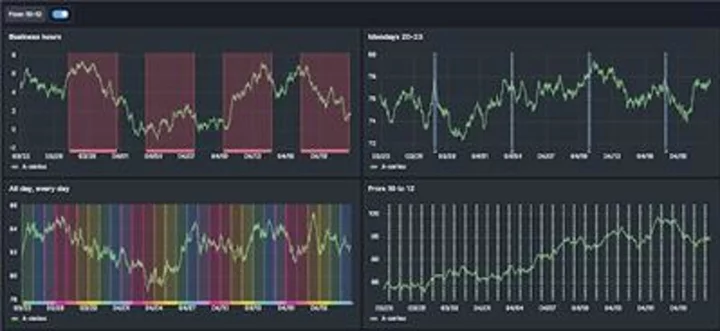
Grafana Labs introduces Grafana 10 (Graphic: Business Wire)
The GrafanaCON keynote, delivered by Grafana creator Torkel Ödegaard, is streaming live today from Stockholm, Sweden, the birthplace of Grafana.
Ödegaard created Grafana in 2013 when he was a developer trying to monitor his application behavior and performance and was frustrated by the limitations of existing visualization tools. His vision was an open source tool for easily visualizing and querying observability data from any data source, and Grafana was born.
Grafana was an instant hit with developers and DevOps and platform teams working with time-series data and became the de facto visualization for Prometheus monitoring data. But that was just the beginning. Grafana’s open architecture and plugin model attracted a wide range of use cases across a global community. Grafana allowed developers, for the first time, to easily visualize all their disparate data in a standardized way across their entire cloud infrastructure, without being limited to a single data source or locked into a proprietary observability solution.
“What’s been remarkable about the success of Grafana is the evolution of the visualization capabilities that have really blossomed as the Grafana dashboard became ubiquitous," said Ödegaard. "Grafana isn’t just a visualization front-end for IT infrastructure, it’s monitoring all kinds of other environments, from space travel, to distributed agtech farms, to research projects in academia. This is truly a project driven by its users, and it’s incredible how big its footprint has become and how many great new ideas for visualizations and use cases keep pouring in from the community.”
Grafana 10: Making Data Visualization Easier and More Powerful
Grafana 10 offers an enhanced onboarding experience that makes it possible for new users to install Grafana, set up data sources, and create their first dashboard in minutes.
This release includes a new suite of advanced features emphasizing efficiency and intuitive navigation, and improvements in user authorization and resource organization that enable swift data retrieval.
Enhanced security and scalability are integral to Grafana 10. Highlights include an expanded Role-Based Access Control (RBAC) system and streamlined SAML authentication setup. Grafana Cloud now offers a secure way to connect to your on-prem and cloud-hosted data sources, securely unifying data that is distributed across your hybrid infrastructure.
Team collaboration is another central theme in Grafana 10. Updates to the public dashboard feature enable knowledge sharing with external stakeholders. Plus, with the Correlations feature, you can seamlessly pivot and link between disparate data sources, making it easier than ever to create a unified view of your entire data landscape and accelerate troubleshooting.
"Observability data – in its early days, the domain of site reliability and platform engineering teams – has exploded in popularity with developers at large,” said Tom Wilkie, CTO at Grafana Labs. "Grafana 10 has elevated the developer UX for observability data so any developer can jump right in and get started connecting data sources, creating dashboards, and sharing and extending these resources to teammates.”
For more information about Grafana 10, read the blog post. To try out the new features, upgrade to Grafana 10 now or spin up a Grafana Cloud account for free.
Observability’s Largest Ecosystem of Supported Clouds and Data Sources
As Grafana hits its 10-year anniversary, the most popular and ubiquitous visualization technology for observability has reached new milestones.
Grafana has surpassed 20 million users. There are now Grafana plugins for more than 150 data sources, both open source and commercial. In the Grafana Labs 2023 ObservabilitySurvey, 38 percent of respondents said they have more than 7 data sources configured in Grafana.
The fully managed Grafana Cloud offering is the easiest way to get started with Grafana and observability, with the LGTM Stack composed of Loki for logs, Grafana for visualization, Tempo for traces, and Mimir for metrics. As Grafana has become the window into so many systems and processes, Grafana Cloud has grown to include load and performance testing, incident response and management, continuous profiling, and turnkey integrations for infrastructure monitoring.
Grafana Cloud has a generous “forever free” tier, which includes 3 users, 10k metrics, 50GB logs, 50GB traces, 500 virtual user hours for k6 load testing, IRM, continuous profiling, infrastructure monitoring, and more. Today at GrafanaCON, Grafana Labs CEO Raj Dutt announced that the company is adding even more to the Grafana Cloud free tier, including access to all enterprise plugins for data sources such as ServiceNow, Splunk, Snowflake, Datadog, MongoDB, Oracle, New Relic, Dynatrace, Wavefront, and AppDynamics.
Grafana Cloud is also available across all the major cloud providers: AWS Marketplace, Microsoft Azure Marketplace and Google Cloud Marketplace. Additionally, Grafana Labs has partnerships with Tencent Cloud and Alibaba Cloud for managed Grafana offerings in the Asia-Pacific region.
Highlighting New Community Use Cases at GrafanaCON
As part of the 10-year anniversary celebration, GrafanaCON will showcase the breadth of use of Grafana today.
Libre Space Foundation core contributor Patrick Dohmen will showcase how Grafana is used to track satellites. Amandeep Ratte will highlight Grafana’s use in the distributed agricultural systems industry. Djamel Djedid from DHL Express Switzerland will demonstrate how Grafana, Prometheus, and Grafana k6 load testing are transforming IT and business flows at one of the world’s largest logistics and shipping companies. Sentry Software CEO Bertrand Martin will discuss how his company used Grafana and OpenTelemetry to analyze its energy footprint and achieve its sustainability goals.
During the keynote, Raj Dutt also presented the first ever Golden Grot Awards, which recognize dashboards created by community members. The winner in the personal category, Nicky Sonnemans, built a public dashboard that provides visibility into energy infrastructure and real-time costs across Europe. Raymond Sowden, CNC team lead at South Africa-based RadixTrie PTY LTD, topped the professional category for his team’s dashboard, which gives their technicians and customers insights into the overall health and performance of Oracle’s JD Edwards EnterpriseOne ERP.
Resources
Tune in to GrafanaCON: https://grafana.com/about/events/grafanacon/2023/
Read the Grafana 10 release blog: https://grafana.com/blog/2023/06/13/grafana-10-release-all-the-new-features-to-know
About Grafana Labs
Grafana Labs provides an open and composable monitoring and observability stack built around Grafana, the leading open source technology for dashboards and visualization. There are more than 3,000 Grafana Labs customers, including Bloomberg, Citigroup, Dell Technologies, Salesforce, and TomTom, and more than 20 million Grafana users around the world. Grafana Labs helps companies manage their observability strategies with the LGTM Stack, which can be run fully managed with Grafana Cloud or self-managed with the Grafana Enterprise offerings, both featuring scalable metrics ( Grafana Mimir ), logs ( Grafana Loki ), and traces ( Grafana Tempo ) as well as extensive enterprise data source plugins, dashboard management, alerting, reporting, and security. Grafana Labs is backed by leading investors Lightspeed Venture Partners, Lead Edge Capital, GIC, Sequoia Capital, Coatue, and J.P. Morgan. Follow Grafana Labs on LinkedIn and Twitter or visit https://grafana.com.
View source version on businesswire.com:https://www.businesswire.com/news/home/20230613705935/en/
CONTACT: Carly Driggers
carly@storychangesculture.com
415-515-9812
KEYWORD: SWEDEN EUROPE
INDUSTRY KEYWORD: DATA MANAGEMENT SECURITY APPS/APPLICATIONS TECHNOLOGY SOFTWARE INTERNET HARDWARE
SOURCE: Grafana Labs
Copyright Business Wire 2023.
PUB: 06/13/2023 11:00 AM/DISC: 06/13/2023 11:01 AM
http://www.businesswire.com/news/home/20230613705935/en


