The MLB standings by pitching whiff rate give us a good sense of which teams are throwing the best stuff.
Few sporting acts can capture the poetry of motion quite like pitching a baseball. Every pitcher operates as their own unique pace. Each wind-up has its own cadence, each release its own motion. The movement of one pitcher's two-seam fastball can be completely different from the movement of another pitcher's two-seam fastball.
That poetry can often determine whether a team contends in the MLB. There's no winning the World Series without a strong starting lineup or aces in the bullpen. Usually, it takes both. The best teams keep the opposition off the bases and off the scoreboard.
Ultimately, the win-loss standings are all that matter. At least in the regular season. But, we can glean plenty of information from standings that are adjusted to account for a specific facet of the game. In this case, we will focus on pitching — and opponent whiff rate — to judge which teams are throwing the nastiest stuff on the mound.
MLB standings ordered by pitching whiff rate
- Atlanta Braves (29.6%)
- Houston Astros (28.8%)
- Miami Marlins (28.4%)
- Chicago White Sox (28.4%)
- Los Angeles Angels (27.5%)
- Minnesota Twins (27.3%)
- Toronto Blue Jays (27.1%)
- Arizona Diamondbacks (26.5%)
- Philadelphia Phillies (26.3%)
- Texas Rangers (26.2%)
- Seattle Mariners (26.2%)
- Cincinnati Reds (26.2%)
- San Diego Padres (26.0%)
- New York Mets (26.0%)
- Tampa Bay Rays (26.0%)
- Boston Red Sox (25.7%)
- Baltimore Orioles (25.6%)
- New York Yankees (25.3%)
- Chicago Cubs (25.0%)
- Pittsburgh Pirates (25.0%)
- Los Angeles Dodgers (24.8%)
- Milwaukee Brewers (24.7%)
- Kansas City Royals (24.7%)
- Detroit Tigers (24.5%)
- San Francisco Giants (24.1%)
- Cleveland Guardians (24.0%)
- St. Louis Cardinals (23.8%)
- Oakland Athletics (23.4%)
- Washington Nationals (23.1%)
- Colorado Rockies (21.0%)
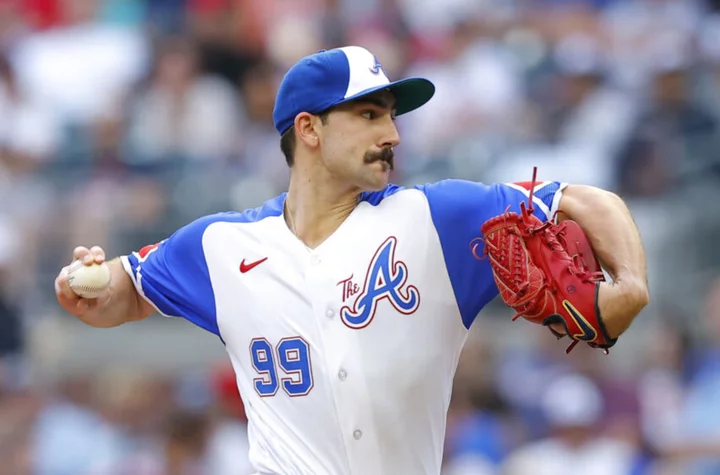
The Braves — led by Cy Young candidate Spencer Strider — are unsurprisingly in the driver's seat. Atlanta continues to dominate both with their bats and with their bullpen, making them arguably the premier contender in all of baseball.
Once you move past the Braves, however, there are fascinating outliers up and down the list.
The White Sox, for example, are tied for the third-highest whiff rate despite being twelve games below .500. On the other hand, the Dodgers fall at No. 21 despite employing one of the most prolific and expensive pitching rotations in the league.
There's more to quality pitching than whiff rate, of course. Not all contact is bad; pitchers who can paint the corners and force grounders or pop-ups are the best in the business. Tom Glavine never made his money racking up K's.
That said, these standings certainly paint a decent picture of the best and worst rotations in the MLB. There's a reason names like Framber Valdez and Shohei Ohtani are nestled comfortably in the top 10 while the most maligned bullpens in the country (St. Louis, Cleveland, Oakland) are all stacked at the bottom.

